
Page 32 - Volume 15 Number 2
P. 32
How much of an increase depends on how dry or moist the air is above the cloud. If there’s a wind shift at the cloud top, normally the increase in the dewpoint depression is fairly dramatic (the winds have shifted to a dryer source region). If the clouds are capped by a temperature inversion (as it is for a stratocumulus cloud deck), there’s usually a dramatic increase in the dewpoint depression. The inversion essentially caps or limits the growth of the clouds. And when the increase isn’t significant, it leaves some uncertainty as to where the tops are actually located (sometimes the case for ragged tops).
There are times where there will be a lot of uncertainly and the sounding may be inconclusive. This is especially true for cold clouds (cloud top temperatures colder than minus 15 degrees Celsius). This is because the air is saturated with respect to ice, not liquid water. So the dewpoint depression isn’t a good way to measure saturation necessarily. The frost point would be better, but that’s not ordinarily displayed on thermodynamic charts.
The top of a cumuliform cloud deck can be a little more difficult to determine since a field of cumulus clouds are often variable in height, sometimes highly variable. Say, for example, a scattered to nearly broken field of cumulus clouds exists over the radiosonde station. If the radiosonde ascends through a towering cumulus cloud, you’ll likely see a very deeply saturated atmosphere presented on the sounding. Whereas consider that same radiosonde ascending in between these cumulus clouds. You might see a rather dry sounding as the result.
The more serious issue with using RAOBs is the coarse temporal and spatial resolution of the data. Radiosondes are ordinarily launched twice a day. Moreover, these stations are so spread out that
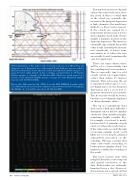
The temperature on this radiosonde observation shown on a Skew-T log (p) diagram out of Bismarck (in south-central North Dakota) was recorded a little more than three hours after the visible and infrared satellite images (on page 26) were taken. Based on this sounding, a temperature of -15 degrees Celsius equates to a height of 12,000 feet MSL. Therefore, a pale green color shown on the infrared satellite image (on page 26) near Bismarck implies tops around 12,000 feet MSL.
Below, this VAD wind profile (VWP) from the NWS NEXRAD Doppler radar out of Bismarck shows very few scatterers at 12,000 feet and above implying the likelihood of cloud-free air above 12,000 feet MSL.
30 • TWIN & TURBINE
FEBRUARY 2011
