
Page 17 - Volume 15 Number 1
P. 17
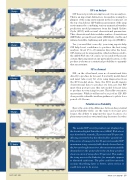
2 hours
3 hours
6 hours
9 hours
12 hours
JANUARY 2011
The masked FIP severity products are displayed on the Aviation Digital Data Service (ADDS) Web site at two thresholds, namely 25 percent and 50 percent. All icing severity below this threshold is “grayed out.” This series of images for the 50-percent masked FIP maximum icing severity field clearly shows that as the forecast length increases, the uncertainty quickly diminishes to the point where the 12 hour product shows no area of icing above 50 percent. This makes the icing area in the Dakotas, for example, appear to diminish with time. The pilot could erroneously assume that flying later is better, when it fact, it could turn out to be worse.
CIP is an Analysis
CIP does not provide an icing forecast; it is an analysis. That is an important distinction. An analysis is simply a glimpse of the icing environment in the recent past. At the top of each hour, CIP builds an assessment of the icing environment by combining various numerical weather prediction model parameters from the Rapid Update Cycle (RUC) with several observational parameters. This observational data includes surface observations (METARs), ground-based radar (NEXRAD), visible and infrared satellite, lightning and pilot reports (PIREPs).
Yes, you read that correctly; your icing reports help CIP help boost confidence to produce the best icing analysis. About 15 to 20 minutes later after the hour, CIP churns out its icing analysis, which is then posted to the ADDS Web site. Of course, we’re rarely 100 percent certain that icing exists at any particular location, so the product is shown as a statistical probability to quantify that uncertainty.
FIP is a Forecast
FIP, on the other hand, uses no observational data directly to produce its forecast. It is strictly model-based and must take every bit of its icing diagnostics from the RUC model alone. Sure, the RUC model ingests observational data to produce its forecast, but FIP must then post-process this raw model forecast data to produce its own icing forecast. This adds even more uncertainty. While it will never be as good as CIP, FIP does provide valuable weather guidance to pilots for a period of 12 hours.
Potential versus Probability
Here’s the crux of the difference between the potential and probability field. As the time-to-forecast gets longer, the ability to pinpoint the exact location of a phenomenon such as structural icing decreases. In other
TWIN & TURBINE • 15
