
Page 6 - Dec18T
P. 6
position report
A Rough Ride
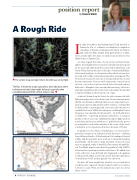
The surface map and radar returns the afternoon of my ight.
The Nov. 4 jet stream analysis provides a clear indication where turbulence and wind shear might be found, especially when considered along with the surface analysis map.
by Dianne White
In early November, my husband and I had traveled to Pensacola, Fla., to celebrate our daughter’s completion of a phase of her pilot training at the Naval Air Station and catch the Blue Angels final performance of 2018.
After a memorable few days, we turned our attention to the flight home to Kansas City.
As often typical this time of year in the northern hemi- sphere, the struggle between seasons is underway as the polar jet moves south and brings the season’s first significant cold fronts. Thus, this was the case on the day of our intended flight. After much analysis, we determined that the front was slow moving with widely scattered precipitation anticipated. The front was forecasted to run out of energy mid-afternoon and become stationary. Closer to the low-pressure center located in Iowa, convection was forecasted down through eastern Missouri to Memphis. Sure enough that morning, cells were starting to manifest north of our route on the radar. We decided to launch midday as the front ran out of gas.
At about 140 nm from the front, the ride was smooth with light rain and pockets of moderate rain. From a strategic point that far out, Nexrad confirmed what we were expecting to see: large areas of green and smaller yellow returns...nothing that looked terribly concerning (read: convective). By the time we reached the front in VMC between layers, our Memphis Center frequency was inundated with aircraft – from FL450 down to 6,000 feet – reporting moderate turbulence. A Citation 40 nm north of our route climbing through 11,000 reported wind shear and severe turbulence. I pulled back the power in anticipation, and within minutes it hit: some of the worst wind shear we’ve experienced in three decades of flying.
In addition to the effects of turbulence, we observed tre- mendous variations in indicated wind direction – shifting from 10 kts tailwind to 48 kts headwind. Groundspeed varied wildly, and the autopilot got a workout to maintain heading and altitude. All the time, I kept my hand on the yoke and eyes on airspeed, ready to hand-fly if necessary. Meanwhile, our ForeFlight map became heavily populated with PIREPs all around us, reporting moderate turbulence. We added ours to the collection. A good friend who happened to be passing overhead at FL450 in a CJ3 told us later that the turbulence “rocked their world” as they passed over the front.
We have all been taught that whether or not wind shear conditions are expected, the pilot must be able to recognize it when it occurs. What are the indications you’re in a wind shear event?
4 • TWIN & TURBINE
December 2018
